Calimesa is located in California. Calimesa, California 92320 has a population of 10,562. Calimesa 92320 is less family-centric than the surrounding county with 23% households with children. The county percentage for households with children is 34%.
The median household income in Calimesa, California 92320 is $70,497. The median household income for the surrounding county is $70,543 compared to the national median of $66,222. The median age of people living in Calimesa 92320 is 47.5 years.
The average high temperature in July is 96.3 degrees, with an average low temperature in January of 39.8 degrees. The annual precipitation is 19.3.
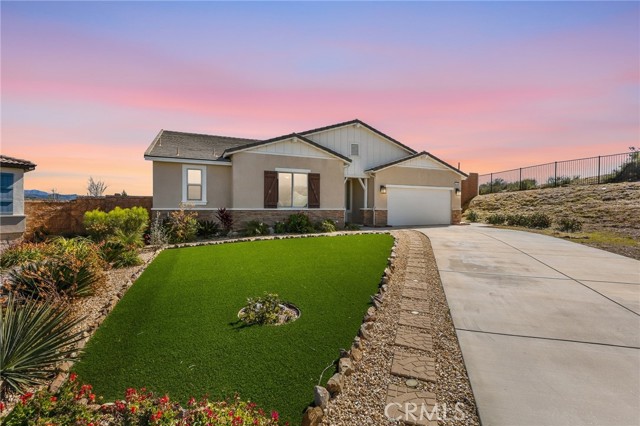
10,680 people live in Calimesa, where the median age is 43.2 and the average individual income is $39,738. Data provided by the U.S. Census Bureau.
Total Population
Median Age
Population Density Population Density This is the number of people per square mile in a neighborhood.
Average individual Income
There's plenty to do around Calimesa, including shopping, dining, nightlife, parks, and more. Data provided by Walk Score and Yelp.
Explore popular things to do in the area, including Chocolates By Carolyn, Cloud Nine Espresso, and Pure Roots Wellness Center.
| Name | Category | Distance | Reviews |
Ratings by
Yelp
|
|---|---|---|---|---|
| Dining · $$ | 3.41 miles | 17 reviews | 5/5 stars | |
| Dining | 0.25 miles | 7 reviews | 5/5 stars | |
| Active | 3.31 miles | 7 reviews | 5/5 stars | |
| Active | 3.17 miles | 7 reviews | 5/5 stars | |
| Nightlife | 3.33 miles | 6 reviews | 5/5 stars | |
| Beauty | 3.28 miles | 7 reviews | 5/5 stars | |
| Beauty | 3.2 miles | 11 reviews | 5/5 stars | |
| Beauty | 3.34 miles | 12 reviews | 5/5 stars | |
| Beauty | 0.69 miles | 11 reviews | 5/5 stars | |
| Beauty | 0.47 miles | 21 reviews | 5/5 stars | |
|
|
||||
|
|
||||
|
|
||||
|
|
||||
|
|
||||
|
|
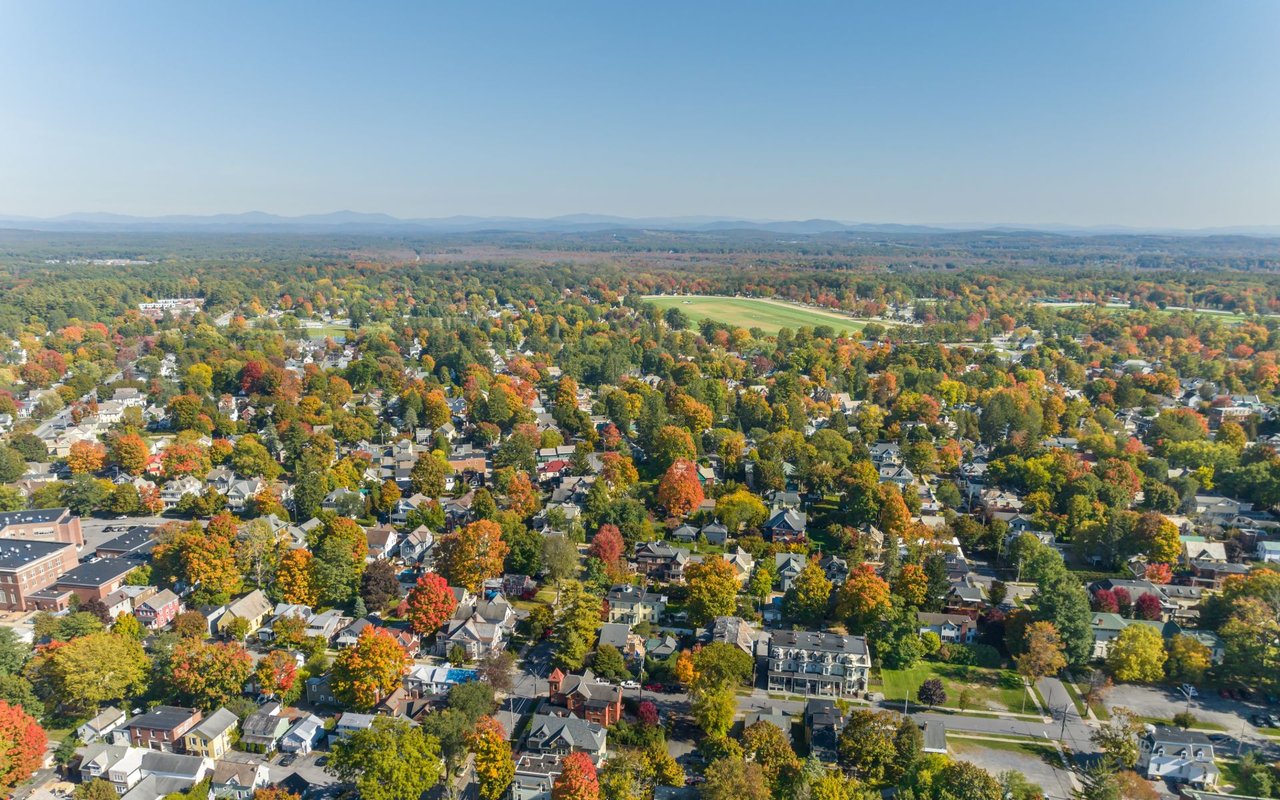
Calimesa has 3,877 households, with an average household size of 2.74. Data provided by the U.S. Census Bureau. Here’s what the people living in Calimesa do for work — and how long it takes them to get there. Data provided by the U.S. Census Bureau. 10,680 people call Calimesa home. The population density is 718.39 and the largest age group is Data provided by the U.S. Census Bureau.
Total Population
Population Density Population Density This is the number of people per square mile in a neighborhood.
Median Age
Men vs Women
Population by Age Group
0-9 Years
10-17 Years
18-24 Years
25-64 Years
65-74 Years
75+ Years
Education Level
Total Households
Average Household Size
Average individual Income
Households with Children
With Children:
Without Children:
Marital Status
Blue vs White Collar Workers
Blue Collar:
White Collar:
Get assistance in determining current property value, crafting a competitive offer, writing and negotiating a contract, and much more. Contact Ramesh today to discuss all your real estate needs!